
Highlights of Bravo’s 2023 Maiden Mineral Resource Estimate (“MRE”) at a 0.50 g/t PdEq cut-off grade
- The maiden MRE for Luanga shows a substantial increase in tonnes and contained metals (Pd, Pt, Rh, Au, Ni) at higher palladium equivalent ("PdEq") grades than the previously reported Historical Estimate (as defined below).
- Indicated Mineral Resource of 73 million tonnes (“Mt”) at 1.75 grams per tonne (“g/t”) of PdEq for 4.1 million ounces (“Moz”) of PdEq.
- Includes 4.6Mt at 1.43 g/t PdEq of Oxide material.
- Additional Inferred Minerals Resources of 118Mt at 1.50 g/t PdEq for a total of 5.7 Moz PdEq.
- Includes 10.0Mt at 1.30g/t PdEq of Oxide material.
- MRE includes of 89,500 tonnes of nickel in sulphides in the Indicated category and 104,600 tonnes Inferred.
- 38% of the MRE in the Indicated category and 62% in the Inferred category.
- Recoverable PdEq MRE grades on sulphide (“Fresh Rock”) material are calculated based on two extensive phases of laboratory flotation testwork performed by Bravo (117 flotation tests) and three programs of historical flotation testwork, including two historical pilot plant tests.
- Sulphide recovery assumptions (based on these tests): Pt 88%, Pd 80%, Rh 59%, Au 56%, Ni 50%.
- Recoverable PdEq MRE grades on Oxide material are calculated based on two programs of carbon-in-leach and gravimetric testwork performed by Bravo, which included 31 leaching tests.
- Oxide recovery assumptions (based on these tests): Au 94%, Pd 73%, Rh 61%, Pt 24%
- MRE is based on commodity price assumptions using a 10-year trailing averages.
- Relative percentages of each metal by PdEq value contribution to the MRE are estimated at: 43% Pd, 30% Pt, 12% Rh, 12% sulphide Ni, and 3% Au.
- MRE is open at depth along the entire 8.1km of strike of the deposit.
- MRE delineated to an average depth of 200m while drilling has demonstrated that mineralization continues to depths of at least ~350m in those areas tested and is still open.
- Significant potential also exists to increase oxide inventory beyond that in the current MRE.
- Trenching program is only partially completed, with the entire Central Sector yet to be trenched, and some trenches still to be completed in the North and Southwest sectors.
“The delivery of our maiden mineral resource estimate after only 15 months from our IPO is arguably Bravo’s most significant milestone to date. The resource estimate underscores Luanga’s size, grade, and potential open-pittable nature, which is supported by straightforward metallurgy", said Luis Azevedo, Chairman and CEO. “On top of such attributes, Luanga has the potential to be one of the few multi-million-ounce sources of such critical and scarce PGM and Ni metals outside regions challenged by political instability, infrastructure shortcomings and permitting complexities. There remains substantial immediate growth potential to this initial MRE. The drilling program is now following up on the encouraging results beyond the current MRE limiting pit constraints, in addition to the continuation of the trenching program, which has proven to be an effective way of assessing oxide mineralization potential. Further, we are progressing with the drilling of the recently identified priority electromagnetic anomalies, which targets massive or semi-massive sulphides, adding to the prospectivity for new discoveries and deposit types at Luanga”.
VANCOUVER, October 22, 2023 – Bravo Mining Corp. (TSX.V: BRVO, OTCQX: BRVMF), (“Bravo” or the “Company”) announced that it has completed an initial MRE for its 100% owned Luanga palladium + platinum + rhodium + gold + nickel project (“Luanga” or “Luanga PGM+Au+Ni Project”), located in the Carajás Mineral Province, state of Pará, Brazil.
Bravo’s maiden and pit constrained MRE has an effective date of October 22, 2023, and it is comprised of 73 Mt grading 1.75 g/t PdEq for a total of 4.1 Moz of PdEq in the Indicated category and 118 Mt grading 1.50 g/t PdEq for 5.7 Moz PdEq in the Inferred category. Table 1 shows a breakdown of the MRE by tonnage, grade and metal content for each metal, weathering type, and resource classification category.
|
Resource Classification |
Weathering |
Average Grades and Contained Metal Estimates |
||||||||||||
|---|---|---|---|---|---|---|---|---|---|---|---|---|---|---|
|
Tonnes |
Pd Eq |
Pd |
Pt |
Rh |
Au |
Ni |
||||||||
|
Mt |
g/t |
Oz |
g/t |
Oz |
g/t |
Oz |
g/t |
Oz |
g/t |
Oz |
% |
Tonnes |
||
|
Indicated |
Oxide |
4.6 |
1.43 |
212,990 |
0.91 |
135,949 |
0,54 |
79,901 |
0.07 |
10,031 |
0.08 |
11,944 |
n/a |
n/a |
|
Fresh Rock |
68.5 |
1.77 |
3,892,313 |
0.78 |
1,705,709 |
0.53 |
1,159,078 |
0.06 |
131,248 |
0.07 |
146,263 |
0.13 |
89,539 |
|
|
Total |
73.1 |
1.75 |
4,105,303 |
0.78 |
1,841,658 |
0.53 |
1,238,979 |
0.06 |
141,279 |
0.07 |
158,207 |
0.13 |
89,539 |
|
|
Inferred |
Oxide |
10.0 |
1.30 |
418,810 |
0.75 |
241,117 |
0.72 |
230,367 |
0.08 |
25,738 |
0.04 |
12,444 |
n/a |
n/a |
|
Fresh Rock |
108.1 |
1.52 |
5,286,970 |
0.60 |
2,082,479 |
0.57 |
1,997,054 |
0.05 |
190,746 |
0.04 |
122,076 |
0.10 |
104,640 |
|
|
Total |
118.1 |
1.50 |
5,705,780 |
0.61 |
2,323,596 |
0.59 |
2,227,421 |
0.06 |
216,484 |
0.04 |
134,520 |
0.10 |
104,640 |
|
Table 1: MRE Declaration at a Cut-off of 0.5g/t PdEq*
* Notes:
-
The MRE has been prepared by Porfírio Cabaleiro Rodriguez, Mining Engineer, BSc (Mine Eng), MAIG, director of GE21 Consultoria Mineral Ltda., an independent Qualified Person ("QP") under National Instrument 43-101 Standards of Disclosure for Mineral Projects ("NI 43-101"). The effective date of the MRE is 22 October 2023.
-
Mineral resources are reported using the 2014 CIM Definition Standards and were estimated in accordance with the CIM 2019 Best Practices Guidelines, as required by NI 43-101.
-
Mineral resources that are not mineral reserves do not have demonstrated economic viability. There is no certainty that all mineral resources will be converted into mineral reserves.
-
This MRE includes inferred mineral resources which have had insufficient work to classify them as Indicated mineral resources. It is uncertain but reasonably expected that inferred mineral resources could be upgraded to indicated mineral resources with continued exploration.
-
The Mineral Resource Estimate is reported/confined within an economic pit shell generated by Whittle software, using the following assumptions:
Generated from work completed by Bravo and historical test work:
-
-
Phase 1 and 2 Metallurgy testwork – Metallurgical recovery in sulphide material of 80% Pd, 88% Pt, 59% Rh, 56% Au, 50% Ni to a saleable Ni-PGM concentrate.
-
Phase 1 and 2 Metallurgy testwork– Metallurgical recovery in oxide material of 73% Pd, 24% Pt, 61% Rh, 94% Au to a saleable PGM ash residue (Ni not applicable).
-
Independent Geotechnical Testwork – Overall pit slopes of 40 degrees in oxide and 50 degrees in Fresh Rock.
-
Densities are based on 26,898 relative density sample measurements. Averages are 1.58 t/m3 oxide, 2.71 t/m3 Saprock and 2.85 t/m3 fresh rock.
-
External downstream payability has not been included, as the base case MRE assumption considers internal downstream processing.
-
Payable royalties of 2%.
-
Metal Pricing:
-
-
Metal price assumptions are based on 10-year trailing averages: Pd price of US$1,380/oz, Pt price of US$1,100/oz, Rh price of US$6,200/oz, Au price of US$1,500/oz, Ni price of US$15,648/t.
-
Palladium Equivalent ("PdEq") Calculation:
-
-
The PdEq equation is: PdEq = Pd g/t + F1 + F2 + F3 + F4
-
Where: F1 = ((Ptp*PtR)/(Pdp*PdR)) x Ptt ; F2 = ((Rhp*RhR)/(Pdp*PdR)) x Rht ; F3 = ((Aup*AuR)/(Pdp*PdR)) x Aut ; F4 = ((Nip*NiR)/(Pdp*PdR)) x Nit;
being P = Metal Price and R = Recovery
Costs are taken from comparable projects in GE21's extensive database of mining operations in Brazil, which includes not only operating mines, but recent actual costs from what could potentially be similarly sized operating mines in the Carajás. Costs considered a throughput rate of ca. 10mtpa:
-
-
Mining costs: US$2.50/t oxide, US$3.50/t Fresh Rock. Processing costs: US$8.50/t fresh rock, US$7.50/t oxide. US$2.50/t processed for General & Administration. US$1.00/t processed for grade control. US$0.50/t processed for rehabilitation.
-
-
Several of these considerations (metallurgical recovery, metal price projections for example) should be regarded as preliminary in nature, and therefore the PdEq calculations should also be regarded as preliminary in nature. Totals may not sum due to rounding.
-
The current MRE supersedes and replaces the Historical Estimate (as defined and described below), which should no longer be relied upon.
-
The QP is not aware of political, environmental, or other risks that could materially affect the potential development of the Mineral Resources.
Luanga Mineral Resource Estimate
The Luanga deposit mineral resource database consists of 394 drillholes (Bravo + historic drilling) inside the mineralized envelope, with 77,612 metres of drilling between 1992 to 2023. This represents 77,493 metres of assayed intervals at an average interval of close to 1m per assay interval. All assayed interval lengths of core used in the mineralized domains are HQ diameter in the oxide and NQ2 diameter in fresh rock, diamond drill core.
All historic data used for the MRE has been validated statistically to show no significant bias, either by twinned drillholes, extensive re-sampling of historic drill core, statistical comparison of historical data with Bravo drilling, and by field validation of collar locations. In addition, the MRE included 10 trenches for a total of 1,339 metres and 1,349 assays at an average sampling interval close to 1m.
Nine mineralized domains were generated based on the six different styles of mineralization as defined in geological section below (Figure 4). The parent block model (Figures 2 & 3) is 25 m x 25 m x 5 m with 5 m x 5 m x 5 m sub-blocks, with interpolation of elements Multiple Indicator Kriging (“MIK”) for each mineralized fresh rock domain and Ordinary Kriging (“OK”) for each oxide domain.
There are no known issues that materially affect the MRE other than the usual risks faced by any mining project in Brazil or other jurisdictions, such as the risks and uncertainties inherent in mineral exploration and development, environmental, permitting, taxation, socio-economic, marketing, political factors or any additional risks listed in the “Forward-Looking Statements” section in this news release.
The metallurgical recovery figures achieved at laboratory scale are based on 117 flotation tests in 2 phases, and more than 30 flotation tests undertaken by the previous owner. Continuous mini-pilot testwork is currently ongoing. Oxide recoveries used in the MRE calculation are based on results generated from two programs (2022 and 2023) of carbon-in-leach and gravimetric testwork performed for Bravo, which included 31 leaching tests. Refer to Schedule 2 of this press release for further details.
Metal price assumptions are derived from the 10-year trailing price averages to smooth out volatility and price cycle movement in each of these metals. For illustration purposes, the pie chart below (Figure 1) shows the relative percentages of metal value contribution to the Luanga MRE using ‘grade x metallurgical recovery x metal price’ for each metal.
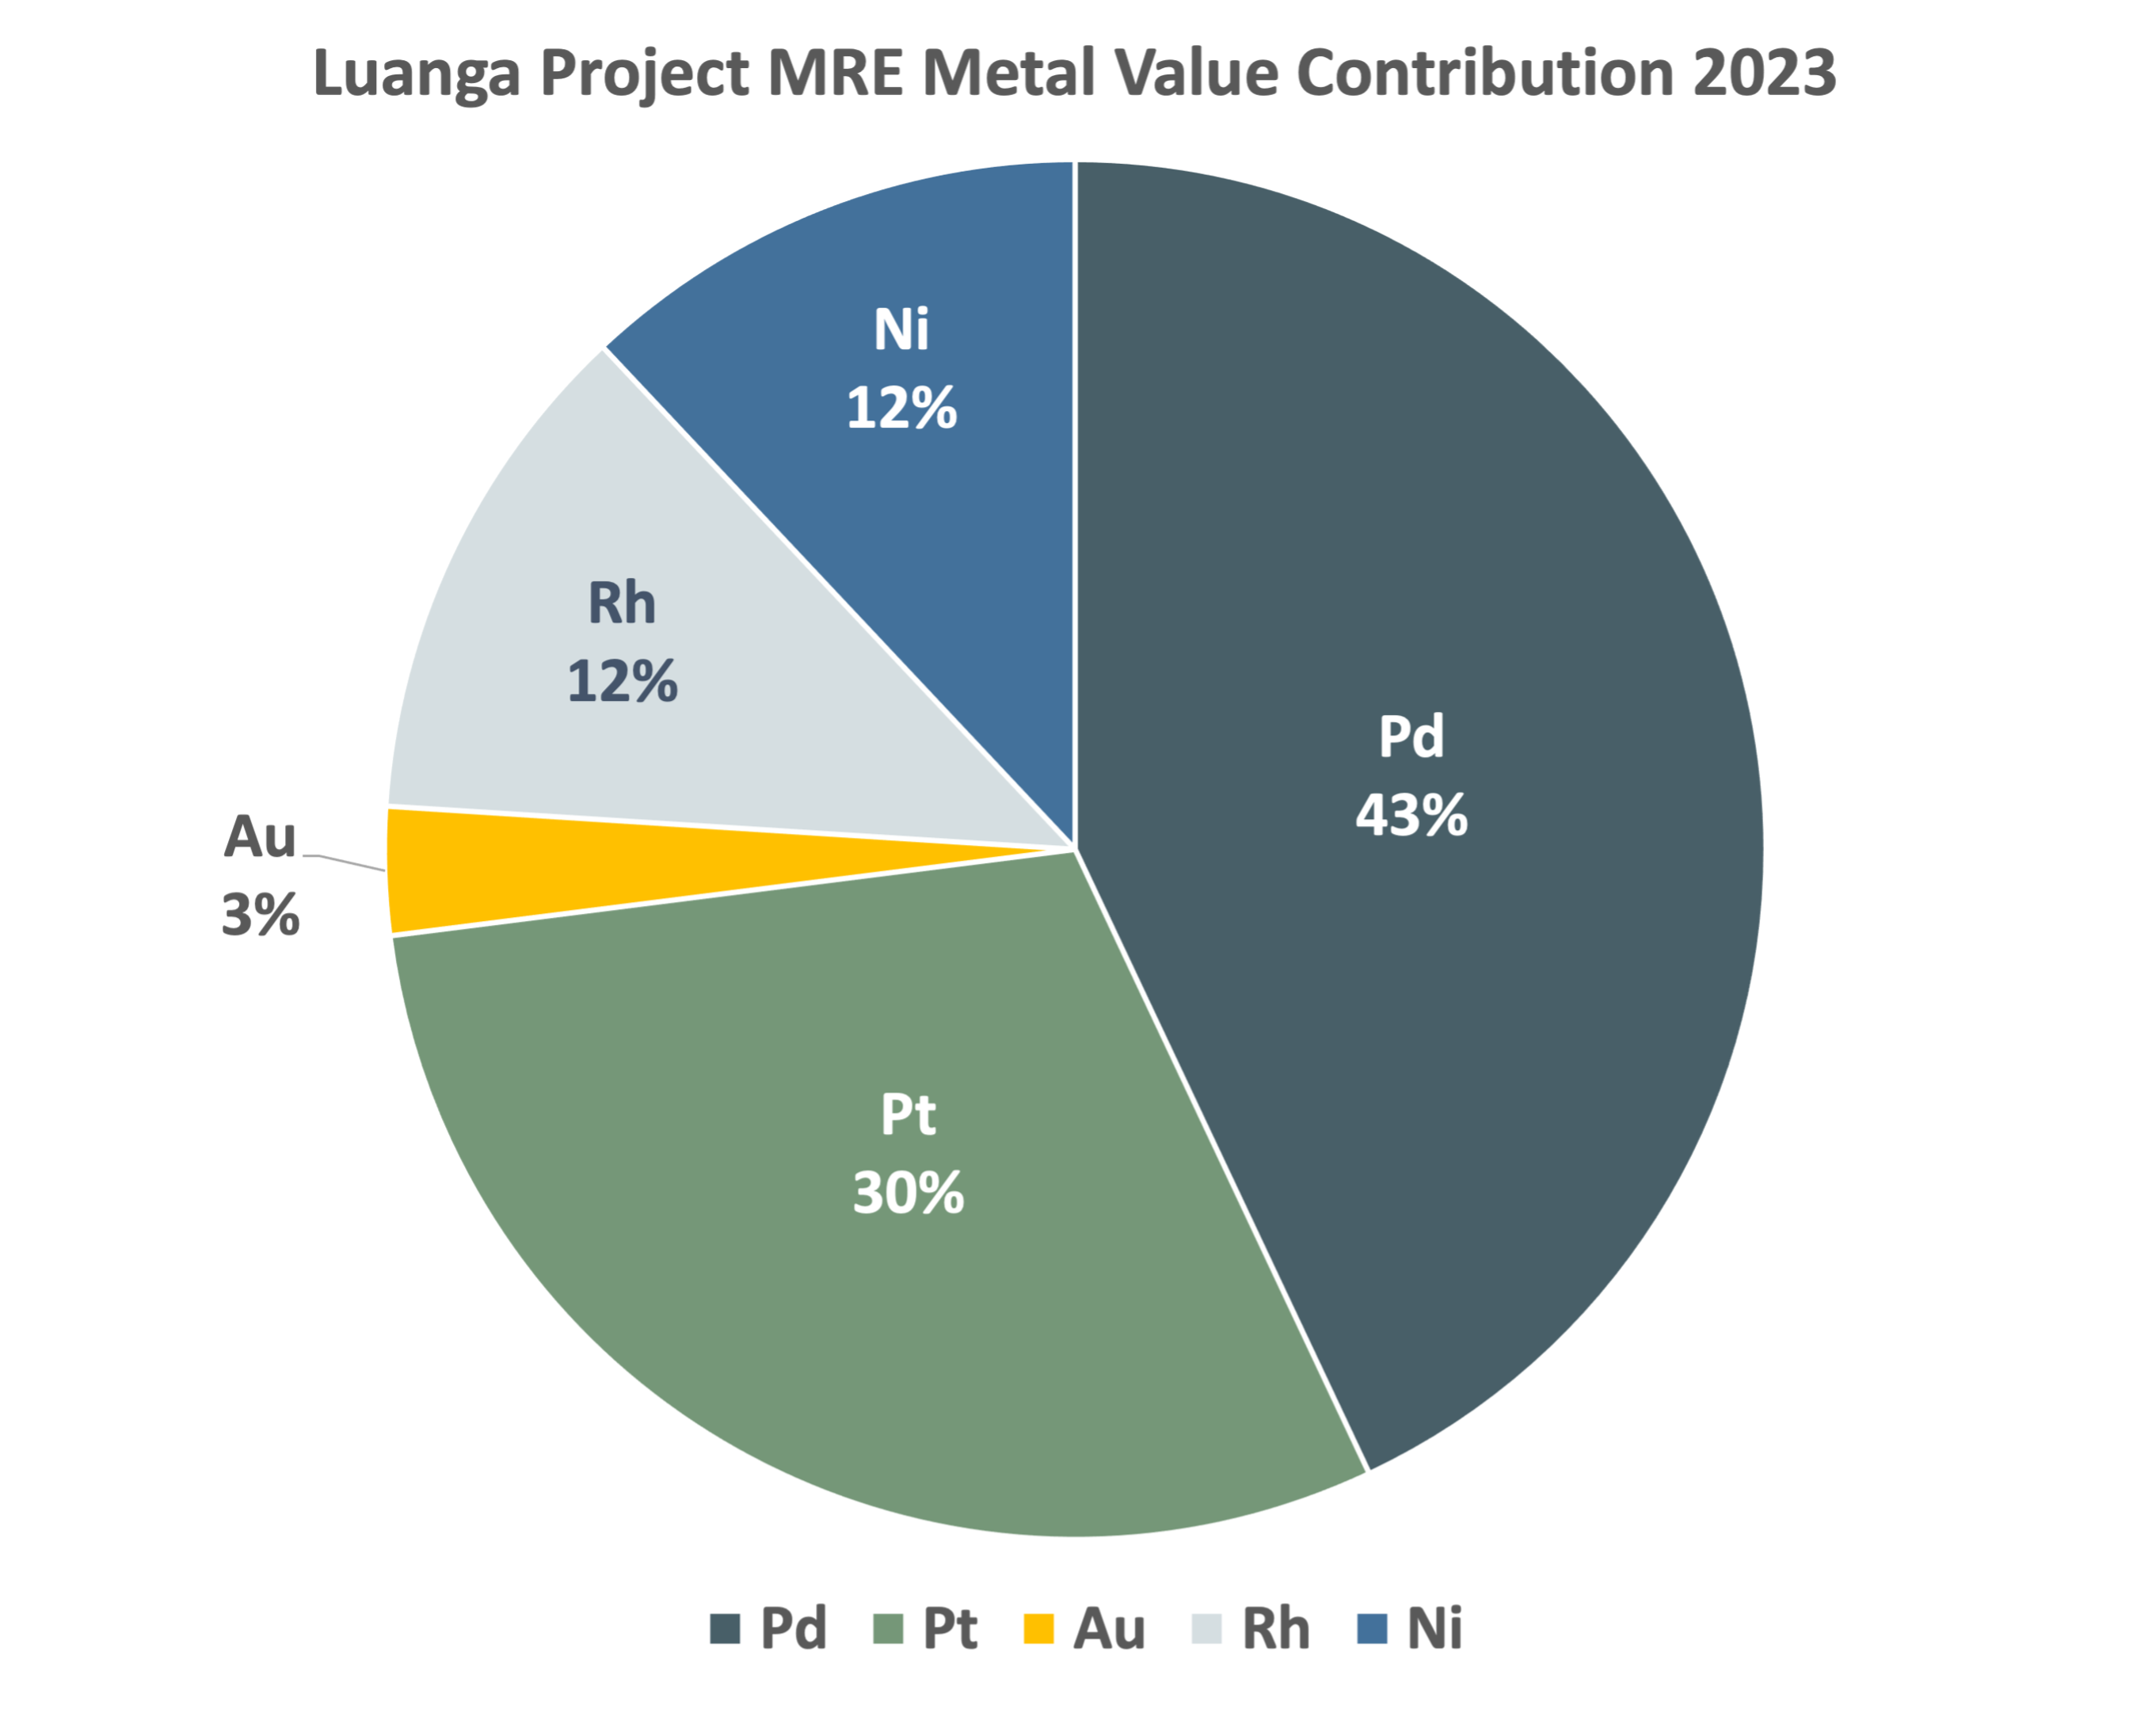 Figure 1: Metal Value Contribution Per Element in the MRE.
Based on recoveries and GE21’s estimates of costs, a cut-off grade (“COG”) of 0.44 g/t PdEq was determined, which Bravo elected to round upwards to a 0.5 g/t COG, adding a further >10% contingency to this calculation to allow for potential future changes in any or several of the assumptions. Refer to Schedule 2 of this press release for further details.
A sensitivity analysis of the COG on the MRE, from 0.1 to 1.0 g/t PdEq, in increments of 0.1 g/t is shown in Table 2.
|
INDICATED |
INFERRED |
||||||
|---|---|---|---|---|---|---|---|
|
PdEq Cut-off grade |
Tonnes |
Distribution |
Recovered |
PdEq Cut-off grade |
Tonnes |
Distribution |
Recovered |
|
(g/t) |
Mt |
(%) |
(g/t) |
(g/t) |
Mt |
(%) |
(g/t) |
|
0.1 |
81 |
100% |
1.58 |
0.1 |
135 |
100% |
1.33 |
|
0.2 |
81 |
99% |
1.60 |
0.2 |
134 |
99% |
1.34 |
|
0.3 |
79 |
98% |
1.62 |
0.3 |
132 |
97% |
1.37 |
|
0.4 |
77 |
94% |
1.68 |
0.4 |
126 |
93% |
1.42 |
|
0.5 |
73 |
90% |
1.75 |
0.5 |
118 |
87% |
1.50 |
|
0.6 |
69 |
85% |
1.82 |
0.6 |
108 |
80% |
1.58 |
|
0.7 |
64 |
79% |
1.91 |
0.7 |
97 |
72% |
1.69 |
|
0.8 |
59 |
73% |
2.01 |
0.8 |
88 |
65% |
1.79 |
|
0.9 |
55 |
68% |
2.10 |
0.9 |
80 |
59% |
1.89 |
|
1.0 |
51 |
63% |
2.18 |
1.0 |
73 |
54% |
1.98 |
Table 2: MRE Sensitivity (grade/tonnes/cut-off) with a 0.5g/t PdEq selected for the base case.
*Notes:
- See footnotes below Table 1 on Page 2.
- The PdEq calculation (as defined by the formula in the footnotes below Table 1) includes metallurgical recovery for each metal. Therefore, the PdEq grade is one that has a reasonable expectation of what can be recovered after allowing for mining and processing costs and recoveries.
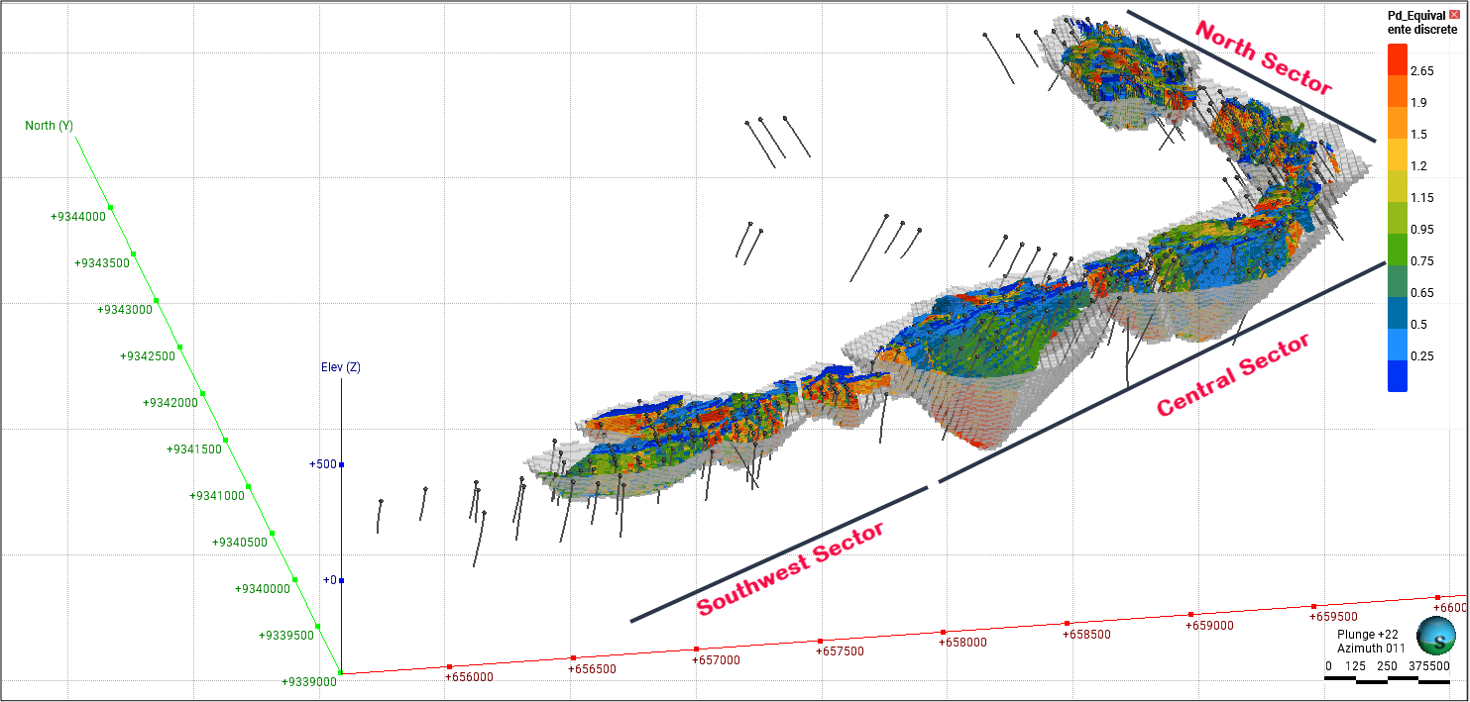 Figure 2: Oblique View of Luanga MRE PdEq grade Distribution within Whittle Pit Shell, over 8.1km of Strike.
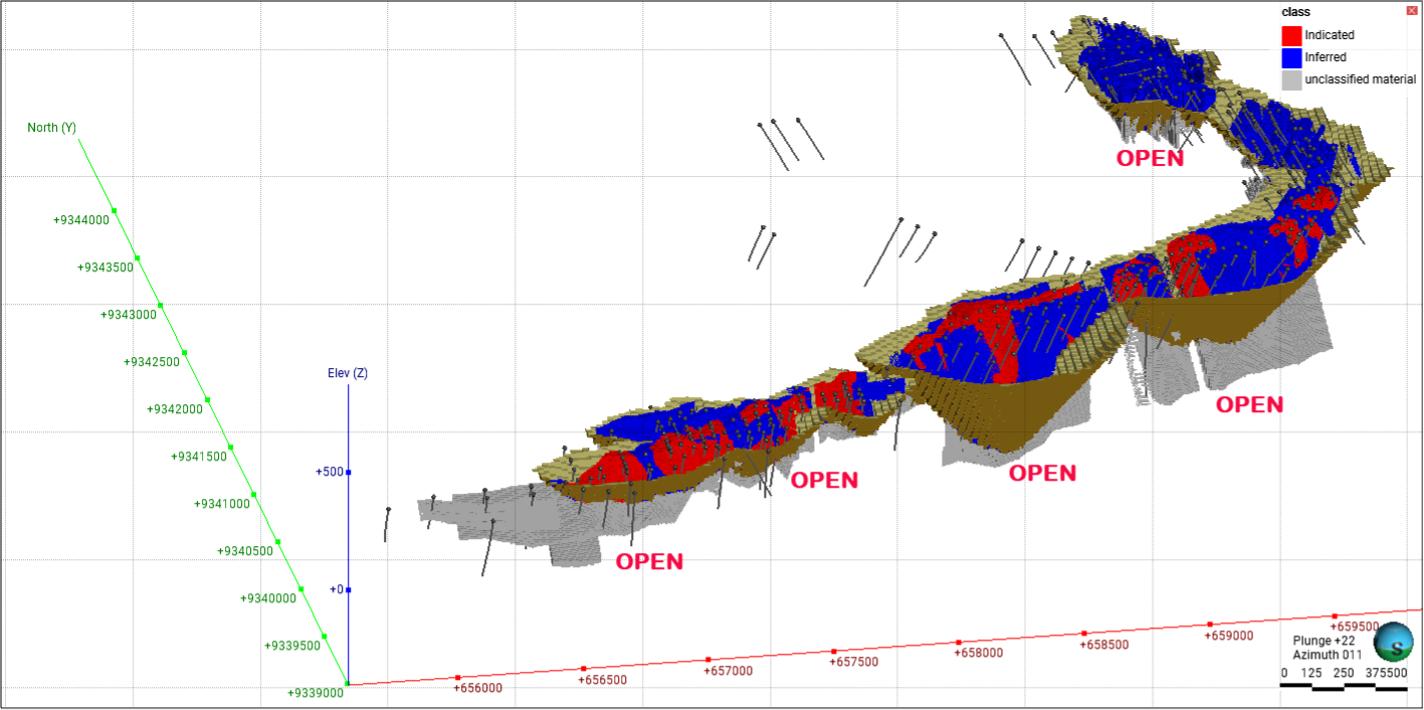 Figure 3: Oblique View of Luanga MRE within Whittle Pit Shell, over 8.1km of Strike.
Comparison with the Previously Published Historical Estimate
A historical estimate (the “Historical Estimate”) prepared internally in 2017 by the prior owner of Luanga indicated a total of “124Mt grading 1.24g/t Pd+Pt+Au and 0.11% Ni using a COG of 0.5g/t PGM+Au” as reported in a technical report prepared for Bravo and titled “Independent Technical Report for the Luanga PGM+Au+Ni Project, Pará State, Brazil” with an effective date of March 28, 2023. Information such as individual metal grades or category was not made available to Bravo, therefore a direct comparison between the Historical Estimate and the current MRE is not possible; nevertheless, it is notable that there has been a significant increase in both the tonnage and grade in the overall current MRE vs the Historical Estimate. This comparison is noted to illustrate the impact on the tonnage and grade in respect of the work completed by Bravo since the Historical Estimate was completed. The Company notes that Rh was not part of the Historical Estimate, and in addition, while Ni grades in the current MRE are almost identical to the Historic Estimate, Bravo’s Ni assays represent sulphide Ni that is potentially recoverable, whereas the Ni grades in the Historical Estimate are total Ni, which includes unrecoverable Ni in silicates.
Mineral Resource growth potential
The Company believes that there is excellent potential to increase this initial MRE at Luanga, as follows:
- The mineralization is open at depth along the entire 8.1km of strike.
- Outside of the Central Sector, the current MRE generally extends to depths that align with the depths of the Phase 1 drilling, typically around 200 metres in the Southwest and North Sectors. This can be seen in Figure 2, where there are few drill holes that extend below the constraining pit shell. Drilling in the Phase 1 (completed) program targeted the depth extent of historical drilling (typically up to ~150m), while the ongoing Phase 2 and 3 programs aim to test the extensions of mineralization to 300+m below surface. To date, only the Central Sector drilling reached depths of ~300m below surface (Figure 4). The cross-section in Figure 5 (Southwest Sector) shows how the lack of data at depth is restricting the MRE. Similarly, in Figure 3, the interpreted continuation of mineralization at depth (unclassified, coloured grey) demonstrates where deeper drilling is required.
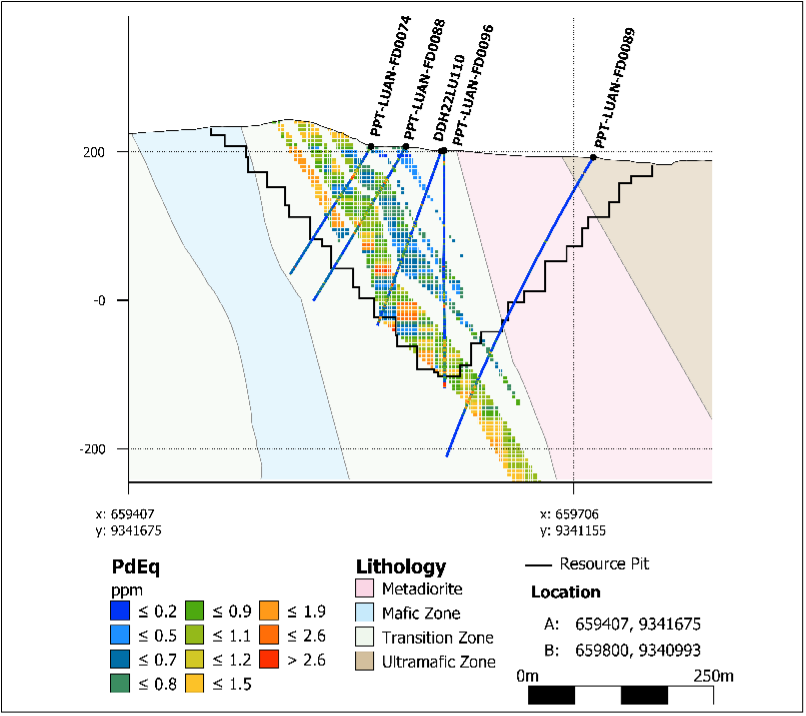
Figure 4: MRE Deeper Section in the Central Sector.
- Several deeper Phase 2 drill holes completed by Bravo in the Central Sector have intersected wider and higher-grade mineralization intervals than typical of the MRE, such as hole DDH23LU175 which reported 54.2m at 3.33g/t PGM+Au, 0.22% Ni from 280.5m, including 32.5m at 4.99g/t PGM+Au, 0.30% Ni from 300.2m (see News Release 15 August 2023). This could indicate potential for higher grades and greater widths of mineralization below the limit of the current MRE, with potential for additional tonnage.
- Bravo’s trenching program is only partially complete, with the entire Central Sector yet to be trenched and some trenches still to be completed in the North and Southwest Sectors. Nevertheless, where completed, trenching indicates a potential for greater aerial extent and typically higher grades (see News Releases 08 May 2023 and 26 September 2023) of oxide mineralization (likely due to supergene enrichment and more extensive surface dispersion). As a result, the current MRE shows a limited extent and lower grades in oxides in areas where no trenching has been completed versus those areas where trenching has been completed. Bravo plans to complete trenching over the entire strike length of the Luanga deposit over the next 6 months and, if recent trends continue, Bravo could expect to see increased tonnes and grade in the oxides versus those within the current MRE. Additionally, trenching to date has identified the presence of high-grade zones within the oxide, which could be studied in later phases as well.
- Some of Bravo’s deeper drilling has intersected several mineralized horizons stratigraphically above or below the main mineralized horizon, which is known as the Main Sulphide Zone (“MSZ”). However, many historic holes and several of Bravo’s earlier drill holes did not extend deep enough to adequately test these horizons (Figure 5). As a result, they are relatively minor contributors to the current MRE. As Bravo continues its deeper drilling and re-enters earlier holes to deepen them, these poorly defined mineralized zones may develop into more significant contributors to future MRE growth.
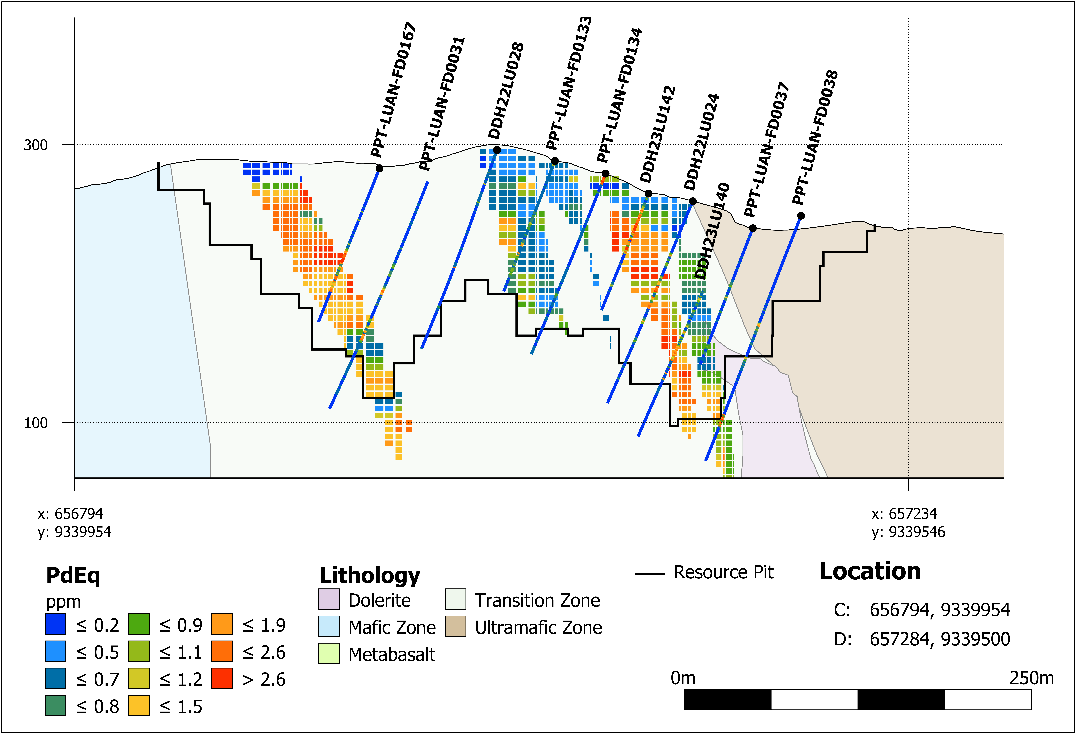
Figure 5: MRE Section Southwest Sector showing Pit reaching limit of drilling data, and additional zone stratigraphically higher.
About Bravo Mining Corp.
Bravo is a Canadian and Brazil-based mineral exploration and development company focused on advancing its Luanga PGM+Au+Ni Project in the world-class Carajás Mineral Province of Brazil.
The Luanga Project benefits from being in a location close to operating mines, with excellent access and proximity to existing infrastructure, including road, rail, and clean and renewable hydro grid power. A fully funded 63,000m infill, step out and exploration drilling is currently underway. Bravo’s current Environmental, Social and Governance activities includes replanting trees in the region, hiring and contracting locally, and ensuring protection of the environment during its exploration activities.
Technical Disclosure and Qualified Persons
Porfírio Cabaleiro Rodriguez, Mining Engineer, BSc (Mine Eng), MAIG, director of GE21 Consultoria Mineral Ltda., is an Independent QP as defined in NI 43-101 and is responsible for the MRE.
An independent peer review was carried out by Anderson Candido FAusIMM (Fellow Australia Institute of Mining and Metallurgy). Mr. Candido is a full-time employee of independent consultancy RPM Global and is an Independent QP as defined in NI 43-101 and was responsible for the independent peer review over the complete MRE process.
Technical assurance was carried out by Professor Mark Noppé MAICD, FAusIMM (CP). Prof. Noppé is the Director of the WH Bryan Mining Geology Research Centre at The University of Queensland, is an Independent QP as defined in NI 43-101 and was responsible for technical assurance and peer review over the complete MRE process.
Each of Mr. Cabaleiro, Mr. Candido and Prof. Noppé has reviewed and approved the scientific and technical information related to the MRE contained in this news release.
Technical information in this news release has also been reviewed and approved by Simon Mottram, FAusIMM, President of Bravo Mining Corp. who serves as the Company’s QP as defined in NI 43-101. Mr. Mottram has verified the technical data and opinions contained in this news release.
Details of the MRE will be provided in a technical report with an effective date of October 22, 2023, prepared in accordance with NI 43-101, which will be filed under the Company’s SEDAR+ profile within 45 days of this news release.
For further information about Bravo, please visit www.bravomining.com or contact:
Alex Penha
EVP Corporate Development
info@bravomining.com
Forward Looking Statements
This news release contains forward-looking information which is not comprised of historical facts. Forward-looking information is characterized by words or sentences such as “potential”, “potentially”, “prospective”, “assume”, “assumptions”, “preliminary”, “if”, “generally”, “expect”, “expected”, “reasonable expectation”, “indicate”, “believe”, “anticipate”, “probable”, “probability”, “plans” variants of these words and other similar words, phrases, or statements that certain events or conditions “could”, “may”, “should” or “will” occur. This news release contains forward-looking information pertaining to the Company’s maiden MRE; the potential for future MRE growth from deeper drilling, and/or additional zones and/or drilling of geophysical targets; potential repeatability and improvements to the economic assumptions and/or to metallurgical recoveries used in the MRE; and the Company’s plans in respect thereof. Forward-looking information involves risks, uncertainties and other factors that could cause actual events, results, and opportunities to differ materially from those expressed or implied by such forward-looking information. Factors that could cause actual results to differ materially from such forward-looking information include, but are not limited to, unexpected results from exploration programs, changes in the state of equity and debt markets, fluctuations in commodity prices, delays in obtaining required regulatory or governmental approvals, environmental risks, limitations on insurance coverage; and other risks and uncertainties involved in the mineral exploration and development industry. Forward-looking information in this news release is based on the opinions and assumptions of management considered reasonable as of the date hereof, including, but not limited to, the assumption that the assay results confirm that the interpreted mineralization contains significant values of nickel, PGMs and Au; that the mineralization remains open to depth; that Ni grades are improving to depth; that future drill and assay results will be in line with management’s expectations; that exploration and other business activities will not be adversely disrupted or impeded by regulatory, political, community, economic, environmental and/or healthy and safety risks; that the Luanga project will not be materially affected by potential supply chain disruptions; and general business and economic conditions will not change in a materially adverse manner. Although the Company believes that the assumptions and factors used in preparing the forward-looking information in this news release are reasonable, undue reliance should not be placed on such information. The Company disclaims any intention or obligation to update or revise any forward-looking information, other than as required by applicable securities laws.
Historical Estimate
This press release contains information relating to the Historical Estimate. No qualified person (as defined in NI 43-101) has done sufficient work to classify the Historical Estimate as current mineral resources or mineral reserves under NI 43-101 and Bravo is not treating the Historical Estimate as current mineral resources or mineral reserves. The Historical Estimate is superseded by the current MRE, and it should no longer be relied upon.
Cautionary Note for U.S. Investors Concerning Mineral Resources
This news release has been prepared in accordance with the requirements of the securities laws in effect in Canada, which differ from the requirements of United States securities laws. The terms “mineral resource”, “indicated mineral resource” and “inferred mineral resource” are defined in and required to be disclosed by NI 43-101; however, these terms are not defined terms under the U.S. Securities and Exchange Commission (“SEC”) modernization rules, known as “S-K 1300”, and are normally not permitted to be used in reports and registration statements filed with the SEC. Investors are cautioned not to assume that all or any part of an “indicated mineral resource” or “inferred mineral resource” will ever be upgraded to a higher category or converted into mineral reserves in accordance with S-K 1300. “Inferred mineral resources” have a great amount of uncertainty as to their existence, and great uncertainty as to their economic and legal feasibility. Under Canadian rules, estimates of inferred mineral resources may not form the basis of feasibility or pre-feasibility studies, except in rare cases. Investors are cautioned not to assume that all or any part of an inferred mineral resource exists or is economically or legally mineable. Disclosure of “contained ounces” in a mineral resource is permitted disclosure under Canadian regulations; however, the SEC normally only permits issuers to report mineralization that does not constitute “reserves” by SEC S-K 1300 standards as in place tonnage and grade without reference to unit measures. Accordingly, information contained in this News Release contain descriptions of the Company’s mineral deposits that may not be comparable to similar information made public by U.S. companies subject to the reporting and disclosure requirements under the United States federal securities laws and the rules and regulations thereunder.
Schedule 1: Schedule: Key Assumptions and Methods Used for the Mineral Resource Estimate
Variography and Interpolations
Grade estimation for sulphide material was completed using the MIK technique, for each element and for each domain. Ten grade increments levels were used to define indicators for each element. Variography and MIK were performed using Isatis.neo software and reported for each respective domain. No grade variables were capped. Grade estimation for oxide material was completed using the OK technique, for each element and for each domain.
Cut-off Grade
The PdEq COG of 0.5 g/t was calculated by taking the all-in cost (oxide and fresh rock) and dividing them by the value of one gram of Pd multiplied by metallurgical recovery. From this a global average (rounded up from the calculated value of 0.44g/t) of 0.5 g/t PdEq has been chosen as the COG. Rounding to 0.5g/t adds a further >10% contingency to the calculation process to accommodate potential future changes in any, or several of, the assumptions.
|
COG (PdEq) |
||
|---|---|---|
|
Oxide |
Units |
|
|
Costs |
14.0 |
US$/t |
|
DGV1 |
31.95 |
US$/g |
|
Cut-Off |
0.43 |
PdEq/ g/t |
|
Fresh |
Units |
|
|
Costs |
16.0 |
US$/t |
|
DGV1 |
35.5 |
US$/g |
|
Cut-Off |
0.44 |
PdEq/ g/t |
|
Avg Cut-off |
0.5 |
PdEq/ g/t |
1 Deposit Grade Value (“DGV”) = (P-Pd/31.1035) * R-Pd
Where: P-Pd = Palladium Price in US$/oz,
R-Pd = Palladium Metallurgical Recovery
Classification of Mineral Resource
To classify mineral resources, a study of spatial continuity for PdEq was conducted using variography followed by ordinary kriging interpolation. This study established a continuity zone suitable for considering as "Indicated Mineral Resources", with a drilling grid of approximately 75m x 75m, extending both along the strike and dip directions, and requiring a minimum of two drill holes. Subsequently, manual post-processing was undertaken to construct wireframes representing the volumes categorized as Indicated, while considering the blocks within the resource pit shell. Any remaining blocks within the resource-limiting pit were classified as "Inferred Mineral Resources".
Reasonable Prospect for Eventual Economic Extraction
The reported MRE is pit constrained using Whittle software to create a pit shell that has reasonable prospects for eventual economic extraction. Relevant parameters used in the mineral resource estimate are shown below the MRE table and include commodity prices used, metallurgical recoveries, geotechnical assumptions, and cost structures. Further, there are no known environmental or community matters that are likely to constrain the future extraction of the reported MRE.
Schedule 2: Preliminary Metallurgical Analysis
Metallurgical recoveries used in the MRE calculation are as follows:
- Sulphide (Fresh rock) recovery inputs: Pt 88%, Pd 80%, Rh 59%, Au 56%, Ni 50%
- Oxide recovery inputs: Au 94%, Pd 73%, Rh 61%, Pt 24%.
Fresh rock recoveries used in the MRE calculation are based on results generated from two extensive phases of laboratory flotation testwork performed by Bravo (117 flotation tests) and three programs of historical flotation testwork, including two historical pilot plant tests. Results indicate that Luanga mineralization has the metallurgical character to potentially produce saleable PGM (Platinum Group Metal) + sulphide Ni concentrates at grades in line with grades achieved for PGM operators in established jurisdictions around the world, including concentrate grades of +80 g/t PGM, 5-10% Ni + Cu and S of 20–30% at the feed grade range of 1-2 g/t PGM. Bravo testwork considered geospatially representative samples with feed grades ranging from 0.9 – 7.0 g/t PdEq. Final concentrate grades produced in the Bravo test work ranged from 37–475 g/t PGM, with a weighted average grade of 134 g/t PGM.
Bravo sample test results demonstrate significant improvement over historical metallurgical results driven by the following key factors:
- Identification and application of fines flotation regimes demonstrating a material improvement of +6% on rougher recoveries while maintaining concentrate grade. Further cleaner improvement is anticipated from planned testing.
- Optimization of flowsheet and reagent suite, resulting in significant selectivity and recovery improvement at the rougher stage, and the production of high-grade concentrates, which provides potential for blending and concentrate quality optimization.
Oxide recoveries used in the MRE calculation are based on results generated from two programs (2022 and 2023) of carbon-in-leach and gravimetric testwork performed for Bravo, which included 31 leaching tests.
The conceptual oxide processing flowsheet has been validated at each processing stage through testwork, including: PGM solubility in the presence of cyanide at ambient temperature/pressure and within reasonable reagent dosage conditions; PGM adsorption onto carbon; Final product generation as saleable high grade PGM ash residue (“ashing” or “ashed” is the burning of the loaded carbon for final mass reduction to an ultra-high grade ash residue) with an assayed average grade of 119,100g/t PGM (or 11.91% PGM). Bravo’s current data demonstrates a high probability for economic recovery of PGM from oxide material at Luanga through conventional cyanide leaching, carbon-in-leach extraction, and ultra-high grade ‘ashed’ residue production. The recommendations for oxide metallurgical input into the MRE are based on laboratory-generated factual data for each stage of processing to a final product, from the Luanga 2022 and 2023 programs. Key factors that have contributed to successful recovery of PGM from oxide material include:
- Intense host rock weathering in oxide and a high degree of naturally liberated PGM, contributing to lower mining and comminution costs.
- High degree of solubility in cyanide, particularly for Au, Pd and Rh.
- High PGM absorption kinetics and recovery for PGM onto carbon.
Details of the 2022 and 2023 metallurgical programs and their results will be documented in the Technical Report (effective date of October 22, 2023) prepared in accordance with NI 43-101, which will be filed under the Company’s SEDAR profile within 45 days of this news release.
Schedule 3: Geological Interpretation
Luanga is a layered mafic-ultramafic complex consisting of a 6km across (on surface) and up to 3.5km wide ovoid-shaped intrusion, which hosts 8.1km (strike length) of mineralization. Today, the Ultramafic Zone (“UZ”) overlies the Transition Zone (“TZ”), which overlies the Mafic Zone (“MZ”), suggesting that the sequence is tectonically overturned. These zones are based on the different type and/or proportion of cumulus minerals. The estimated thickness of the layered sequence is 3,500m, as indicated by the extensive drilling in the entral portion of the Complex, which is likely to represent the axial portion of the original magma chamber.
The UZ is up to 800m thick and consists of harzburgites with lesser dunites and lenses of orthopyroxenite in the upper portions (facing criteria, considering the overturned sequence). The lower contact of the UZ with the Xingu Complex and Grão Pará Group is poorly exposed and was mapped mainly by soil sample assays of the geochemistry surveys and ground/aero magnetic data. The contact with the stratigraphically overlying TZ is gradational and characterized by a 5-10m thick sequence of interlayered orthopyroxenite and harzburgite. Typically, harzburgites in the basal UZ consist of variable altered ultramafic rocks with abundant olivine + orthopyroxenite and/or their alteration products. Domains with primary magmatic textures are locally preserved and consist of medium-to coarse-grained harzburgite.
The TZ is up to 1,000m thick, comprised of interlayered ultramafic and mafic cumulate rocks. Interlayering of different rock types in different scales (from centimetres to dozens of metres) is a distinctive feature of the TZ. Cumulate rocks have variable textures, from adcumulate to orthocumulate, and variable assemblages of cumulus and intercumulus minerals. The most common rock types are orthopyroxenite locally with chromite-rich zones/chromitite layers and minor norite/harzburgite layers. Orthopyroxenite is a medium to coarse-grained orthopyroxene cumulate. The texture varies from adcumulate to mesocumulate and orthocumulate with plagioclase as the predominant intercumulus mineral. Primary textures and minerals are variably altered to fine-grained aggregates. Chromitite layers with variable thickness and textures occur mainly in the upper portions of the TZ and the lowermost portion of the MZ. The thickest chromitite-rich layer is up to 60cm, located at the contact between the upper harzburgite and orthopyroxenite layers of the TZ.
The MZ is up to 3,000m thick, comprised of mostly monotonous norites. The norite consists of medium-grained orthopyroxene + plagioclase cumulates. Primary textures and minerals are variably altered to fine-grained aggregates. Minor interlayered ultramafic rocks in the MZ consist mainly of orthopyroxenites.
The Luanga mineralized envelope follows the arc-shaped structure of the mafic-ultramafic complex along a strike of approximately 8.1 km, which is then subdivided into three mineralized sectors named North, Central and Southwest. The TZ at Luanga hosts several PGM mineralized units, including the Main Sulphide Zone (“MSZ”) which hosts the bulk of the Luanga PGM mineral resources. Other mineralized layers are identified within the UZ, and within the TZ.
The proposed genetic model for PGM mineralization considers: (i) the magmatic evolution of the complex; (ii) the petrographic and geochemical differences of mineralization styles; (iii) the PGM assemblages. The mineralization stages are summarized as follows:
- Stage 1 – Early segregation and precipitation of the High PGM low Rh (Pd-Pt), and High Ni-Rh sulphide zones during the crystallization of olivine cumulates in the UZ.
- Stage 2 – The crystallization of olivine cumulates in the UZ with minor crystallization of sulphide minerals progressively upgrading the sulphur content of the residual magma. The TZ marks an abrupt change in the dynamics of the magma chamber, characterized by cyclic units. Sulphur saturation is triggered, and the MSZ PGM-rich layer is precipitated.
- Stage 3 – Periodic magma influxes with continuous segregation from the base metal sulphide liquid and precipitation of Low Sulphide – High PGM zone, in similar conditions to the MSZ.
- Stage 4 – Alteration promotes sulphur loss and PGMs are combined with other elements (As, Sb, Te, Sn and Bi) and form PGM Low Sulphur mineralization. Precipitation of the Massive Sulphide Zone (“MASU”) as a product of a late hydrothermal-magmatic event controlled by local shear zones.
Based on the magmatic evolution of the complex and mineral assemblages, supported by petrographic/chemistry studies, six different styles of mineralization have been identified within Luanga to date, described as follows:
(i) High Pd-Pt, low Rh-Au-Ni mineralization.
(ii) High Ni-Rh, low Pd-Pt-Au mineralization.
(iii) High Pd>Pt, +/- Rh-Au-Ni mineralization (the MSZ, which represents the substantial majority of the tonnage contained in the MRE).
(iv) High Pt>Pd, low Rh-Au-Ni mineralization associated with sulphide-poor layers.
(v) High Pt-Rh, +/- Pd, with low Ni mineralization related to chromitite-rich layers.
(vi) High Pd>Pt + high Ni-Cu, low Rh-Au mineralization associated with massive sulphide layers or zones.
The known mineralized system being evaluated by Bravo is represented by magmatic layers enriched in palladium plus platinum with minor rhodium, gold, and nickel, which together are referred to as “PGM+Au+Ni”. The mineralization is associated with fine-to-medium disseminated sulphides, coarse intercumulus and semi-to-massive sulphides. Pyrrhotite is the most abundant sulphide, followed by pentlandite and locally minor chalcopyrite.
Schedule 4: Assay Methodologies and Quality Assurance/Quality Control (“QAQC”)
Samples follow a chain of custody between collection, processing, and delivery to the SGS laboratory in Parauapebas, state of Pará, Brazil. The drill core is delivered to the core shack at Bravo’s Luanga site facilities and processed by geologists who insert certified reference materials, blanks, and duplicates into the sampling sequence. Drill core is half cut and placed in secured polyurethane bags, then in security-sealed sacks before being delivered directly from the Luanga site facilities to the Parauapebas SGS laboratory (ALS laboratory initially) by Bravo staff. Additional information about the methodology can be found on the SGS or ALS global websites (SGS, ALS) in their analytical guides. Both laboratories are ISO-accredited and independent of Bravo. Historical drilling used a similar QAQC procedures, and as described in the section “Luanga Mineral Resource Estimate” data generated by this work has been validated statistically to show no significant bias, prior to inclusion.
QAQC is maintained internally at the laboratory through rigorous use of internal certified reference materials (“CRM”), blanks, and duplicates. An additional QAQC program is administered by Bravo using certified reference materials, duplicate samples and blank samples that are blindly inserted into the sample batch. If a QAQC sample returns an unacceptable value an investigation into the results is triggered and when deemed necessary, the samples that were tested in the batch with the failed QAQC sample are re-tested.
|
Bravo SGS Geosol |
|||||
|---|---|---|---|---|---|
|
Preparation |
Method |
Method |
Method |
Method |
|
|
For All Elements |
Pt, Pd, Au |
Rh |
Sulphide Ni, Cu |
Trace Elements |
|
|
PRPCLI (85% at 200#) |
FAI515 |
FAI30V |
AA04B |
ICP40B |
|
|
Bravo ALS |
|||||
|
Preparation |
Method |
Method |
Method |
Method |
|
|
For All Elements |
Pt, Pd, Au |
Rh |
Ni-Sulphide |
Trace Elements |
|
|
PREP-31B |
PGM-ICP27 |
Rh-MS25 |
Ni-ICP05 |
ME-ICP61 |
|
|
Historic Drill Assaying SGS Geosol |
|||||
|
Preparation |
Method |
Method |
Method |
Method |
|
|
For All Elements |
Pt, Pd, Au |
Rh |
TOTAL Ni |
Trace Elements |
|
|
Crushed to <200 mesh |
FA30A |
FA30B |
ICP-117 |
ICP-117 |
|